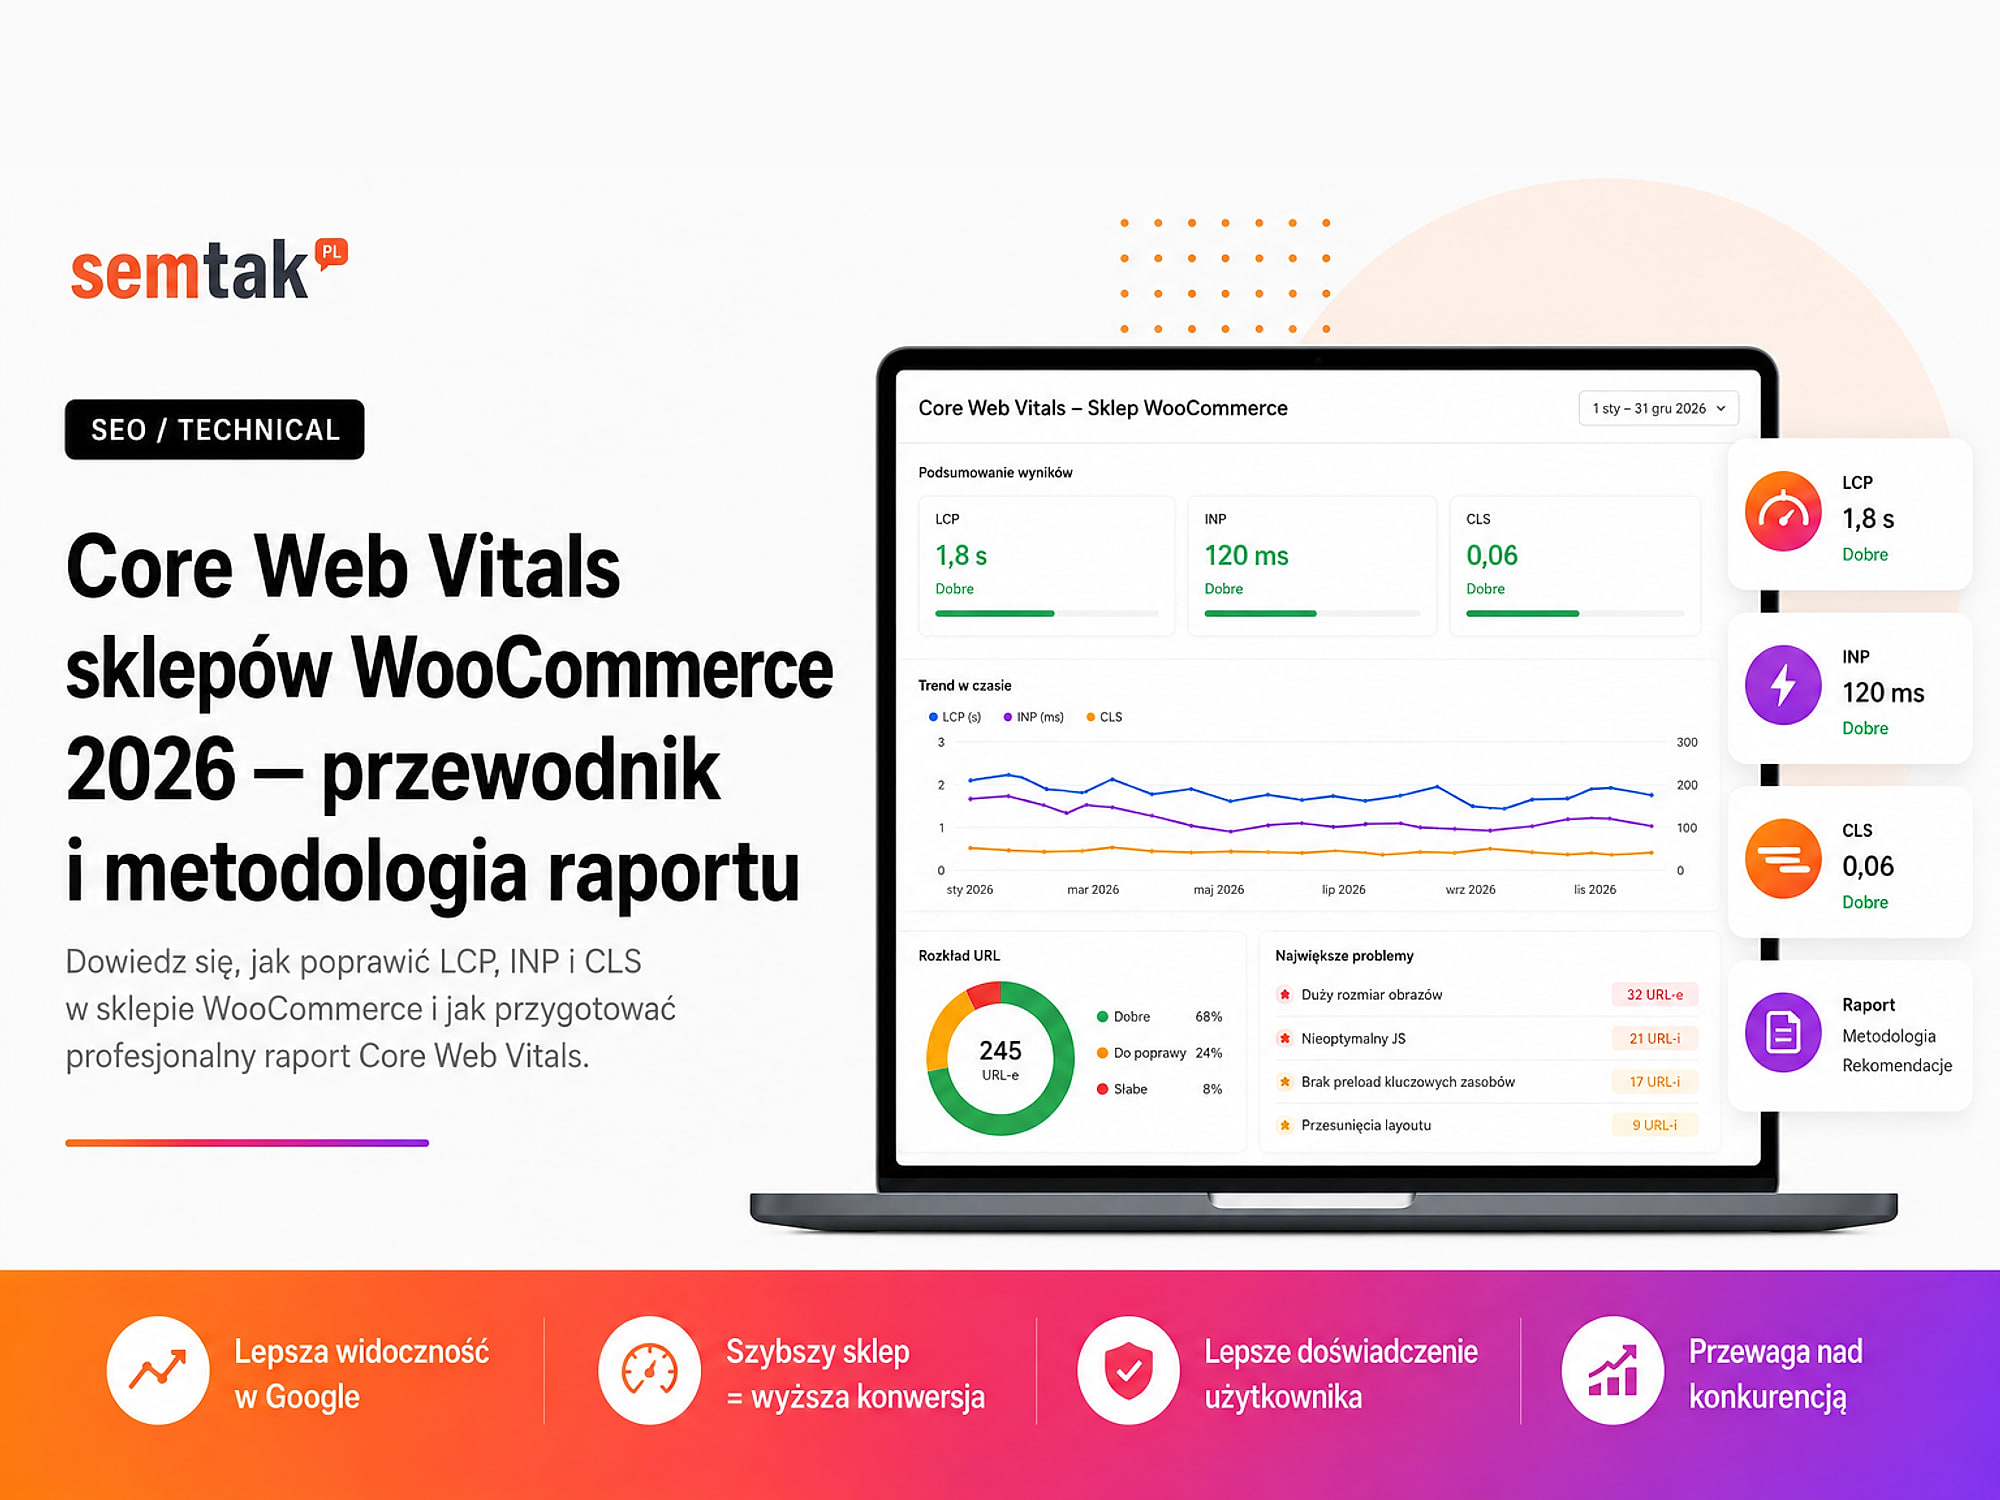
Core Web Vitals of WooCommerce Stores 2026 — Guide and Report Methodology

A store can score 90 points in PageSpeed Insights and still fail the Core Web Vitals assessment in Google Search Console. It can also run fast on the owner's computer yet respond slowly on customers' phones.
The problem usually does not lie in the tool itself. It results from mixing up two kinds of data: the results of real users and tests carried out under controlled conditions.
A reliable Core Web Vitals report should not end with a single "72/100" figure. It must show which page types are slow, on which devices the problem occurs, what causes it and which fixes matter most to the store.
In this guide we show how to prepare such a report for WooCommerce: which URLs to examine, which sources to use, how to interpret LCP, INP and CLS, and how to separate real problems from random test fluctuations.
In short
This report shows how WooCommerce stores really perform on Core Web Vitals using field data (CrUX), and explains the measurement methodology. The key takeaway: a score of 90+ in PageSpeed Insights (a lab test) does not mean passing Core Web Vitals in Search Console (real-user data, mostly from phones). What matters is what the customer sees on their own device, not the result on the owner's computer. How to improve these metrics step by step is explained in the guide Core Web Vitals in a WooCommerce store.
At a glance (TL;DR)
- Core Web Vitals in 2026 cover LCP, INP and CLS. All three must reach a good result at the 75th percentile for a page or group of URLs to pass the assessment.
- Field data comes from real users, while lab data is a simulation. They should not be averaged together.
- WooCommerce must be examined by page type. The home page, category, product and checkout can have completely different problems.
- A Lighthouse score of 90/100 does not automatically mean the store passes Core Web Vitals.
- A good report shows the result, the cause, the priority, the person responsible and the way to verify the fix.
- Field data covers a rolling window of the last 28 days, so a change is not visible immediately after deployment.
Study results: 49 Polish online stores (June 2026)
On 11 June 2026 we measured 49 Polish online stores across industries (furniture, pet supplies, garden, coffee, cosmetics, fashion, home, electrics, supplements). Google provides real-user data (CrUX) for 44 of them. The result: only 14 stores — 32% of the sample — pass the Core Web Vitals assessment.
| CrUX rating (origin) | Stores | Share |
|---|---|---|
| Passes CWV (all metrics good) | 14 | 32% |
| Needs improvement | 23 | 52% |
| Poor | 7 | 16% |
The median LCP in the sample is 1.8 s (good), but the spread is wide: 23% of stores exceed the 2.5 s LCP threshold, 21% exceed 200 ms INP, and 27% fail the 0.1 CLS threshold. The median mobile PageSpeed lab score is just 50/100 (range 23-100). Platform groups: WooCommerce/WordPress passed in 67% of cases (small n=3), PrestaShop/Magento 50%, SaaS platforms 27%, custom builds 25% — the platform does not determine speed; the quality of implementation and ongoing technical care do. The second-fastest store of the whole study was a WooCommerce shop with 4,000+ products under SEMTAK's ongoing technical care (LCP 1.03 s, INP 110 ms, CLS 0.00). Methodology and disclosure: PSI API + origin-level CrUX, purposive sample, three measured stores are under SEMTAK care (excluding them, the pass rate is 31%); full CSV available on request.
What is a Core Web Vitals report for WooCommerce?
A Core Web Vitals report is an organised measurement of a store's speed, responsiveness and stability, based on real-user data and diagnostic tests.
It is not a single screenshot from PageSpeed Insights. The report should answer the questions: does the store pass Core Web Vitals; which metric causes the problem; does it affect phones, computers or both groups; which sub-page types perform worst; is the source the server, an image, JavaScript, the theme or an external service; does the problem occur for real users; what to fix first; and how will we check whether the fix worked. If the report only shows a performance score and a list of automatic recommendations, the store owner still does not know where to start.
A report is NOT a single-URL test in PageSpeed
A single-URL test shows one address, one moment, a Lighthouse analysis and automatic recommendations — it knows neither the purchase process nor the business priorities. A full WooCommerce report covers different sub-page types, takes field data and trend into account, combines field + lab (optionally your own RUM), verifies the actual cause, tests filters, variants, the cart and checkout, and separates critical problems from housekeeping ones. If you are only getting to know the topic, start with the guide Core Web Vitals in a WooCommerce store — what it is and why it affects sales. This article focuses on the methodology of measurement and reporting.
Which Core Web Vitals metrics apply in 2026?
The current Core Web Vitals are LCP, INP and CLS. A page passes the assessment when it achieves a good result for all three metrics at the 75th percentile of visits.
Thresholds (as of 5 June 2026) and the 75th percentile
LCP: good up to 2.5 s, needs improvement 2.5–4 s, poor above 4 s. INP: good up to 200 ms, needs improvement 200–500 ms, poor above 500 ms. CLS: good up to 0.1, needs improvement 0.1–0.25, poor above 0.25. This is not an average: the 75th percentile means that 75% of visits achieved a result no worse than the given value. Google assesses it this way so that the page works well for the majority of users, not only for people with a fast phone and connection.
| Metric | Good result | Needs improvement | Poor result |
|---|---|---|---|
| LCP | up to 2.5 s | above 2.5 to 4 s | above 4 s |
| INP | up to 200 ms | above 200 to 500 ms | above 500 ms |
| CLS | up to 0.1 | above 0.1 to 0.25 | above 0.25 |
Why an average is not enough. An average can hide a problem: if half of the customers see the product after 1.5 s and the other half wait 5 s, the average is 3.25 s — but it does not show that a very large group of users has a clearly worse experience. In the report, present the 75th percentile, the share of good, needs-improvement and poor results, and the change relative to the previous period.
What do LCP, INP and CLS measure in a WooCommerce store?
LCP measures the time it takes to display the largest element in the initial area of the page. In WooCommerce this can be a banner on the home page, a category image, the main product photo, a large heading or a campaign graphic. A poor result may stem from a slow server, a heavy image, fetching the resource too late or blocking code. Lazy loading (deferring the download of an image until it is needed) is useful for images further down the page, but it should not, without control, cover the main image that is the LCP element. Simply shrinking the image does not always fix the result — if the image is only detected after JavaScript has run, its download will still start too late.
INP measures the delay between a user's action and the next change shown on the screen. In a store the important actions are: opening the menu, filters, selecting a variant, adding to the cart, opening the mini-cart, choosing delivery, changing payment and form validation. Poor INP is often associated with a large amount of JavaScript, long tasks, a heavy page builder or an elaborate page structure. The DOM is the structure of HTML elements that build the page — if the theme and builder create thousands of nested elements, each interaction may require more computation.
CLS measures unexpected shifts of elements while using the page. The problem appears when a customer wants to press "Add to cart", but at the last moment a message, banner or new piece of information appears above the button. In WooCommerce the shifts are often caused by images without defined dimensions, a dynamic variant price, a cookie banner, a promotion bar, a reviews section, a chat widget, a late-loading font and a WooCommerce notice.
Is TTFB part of Core Web Vitals?
TTFB is not a Core Web Vital, but it is an important diagnostic metric when examining WooCommerce.
TTFB (Time to First Byte) measures the time from the start of the request to receiving the first byte of the server's response. As a rough guide, most sites should aim for around 0.8 seconds or less — this, however, is not an official Core Web Vitals passing threshold. If the server responds after 2 seconds, the browser can only then begin downloading the document, styles, scripts and images.
What can raise TTFB in WooCommerce: overloaded hosting, too few PHP processes, a slow database, heavy plugin queries, a large amount of autoload data, no object cache, external API calls, geolocation, price personalisation and a large number of variants. Autoload is data from the wp_options table that WordPress loads automatically on every request — if there is too much of it, it can needlessly burden the database and memory. Object cache is a cache of WordPress query results and computations (e.g. Redis) that reduces the number of repeated reads from the database. Not every WooCommerce page can be served with full cache — the cart, checkout and customer account contain data specific to a particular user, which is why they require an efficient backend and a correct session configuration.
Field and lab data — what is the difference?
Field data shows the experiences of real users, while lab data helps reproduce the problem and find its cause.
| Data type | What it shows | Advantage | Limitation |
|---|---|---|---|
| Field / CrUX | Real visits by Chrome users | Shows real experiences | Requires sufficient traffic |
| Your own RUM | Data collected directly in the store | More detail and segments | Requires implementation |
| Lab / Lighthouse | Simulated page load | Repeatable diagnostics | Does not reflect all customers |
| DevTools test | Specific interactions | Helps diagnose INP | Depends on the scenario and device |
Field data comes from real visits. Google's public source is CrUX (Chrome User Experience Report) — it covers qualifying visits by Chrome users and can provide data for a specific URL or the whole domain. In PageSpeed Insights, CrUX data covers a rolling window of the last 28 days. Field answers the question: how did the store perform for real users?
Lab data is produced during a simulated test. Lighthouse analyses the page under specific device, processor and network conditions — it can show the order in which resources are downloaded, blocking files, the LCP element, long tasks, unused JavaScript, layout shifts, the number of requests and the page size. Lab answers the question: what may be causing the problem and does a deployed change improve the result under the same test conditions?
Field and lab are different sources — do not average them
The results may differ because of different devices and networks, user locations, first vs subsequent visit, active cache, cookie consent, personalisation, A/B tests, changing integrations and varied user behaviour. Do not pick the result that looks more favourable — first establish which source it comes from. LCP from CrUX should not be averaged with LCP from Lighthouse.
Why is Lighthouse not a Core Web Vitals assessment?
The Lighthouse score from 0 to 100 is a synthetic assessment of a lab test, not a Core Web Vitals result from real visits.
In the lab section you will find, among others, First Contentful Paint, Largest Contentful Paint, Speed Index, Total Blocking Time and Cumulative Layout Shift. INP is not measured by default in a plain automatic page load, because it requires user interaction. In Lighthouse the diagnostic role is played, among others, by TBT (Total Blocking Time) — it shows the time the main thread is blocked during loading.
TBT ≠ INP, and a score of 90/100 ≠ passing CWV
Do not copy TBT into the INP column, do not treat a score of 90/100 as passing Core Web Vitals, do not compare reports without recording the test conditions, and do not consider a single run the final result. Passing CWV requires good field data for LCP, INP and CLS — Lighthouse is only lab diagnostics.
Which tools to use for a Core Web Vitals report?
Google Search Console shows Core Web Vitals problems at the level of groups of similar URLs — it separates mobile/desktop as well as good, needs-improvement and poor URLs, and it may group product cards from the same template. The report does not show all URLs, requires a sufficient amount of data, is based on real visits and may indicate a problem for a group rather than a single URL.
PageSpeed Insights (PSI) combines CrUX field data with a Lighthouse lab analysis. Before saving the result, check whether the field data refers to a specific URL or the whole domain (origin), whether it is available at all, what period it shows and whether you are looking at mobile or desktop. If a product does not have enough traffic, PSI may show data for the whole domain — in that case you must not present it as the result of a specific product.
CrUX Vis helps observe the historical trend of real results: when the metric started to deteriorate, whether the problem occurs constantly, what the period before and after deployment looks like, and the mobile/desktop differences.
Your own RUM (Real User Monitoring) lets you collect detailed data without being limited to the public CrUX — you can use the web-vitals library and send the results to your own database, an analytics system or GA4, additionally recording the page type, device, template version, LCP element, the interaction causing poor INP, login status, the active experiment and the delivery/payment method. The results of your own RUM and CrUX do not have to be identical — they may cover a different group of users and different data-collection rules.
Chrome DevTools (the Performance panel) is used for technical analysis of loading and interactions — it helps find the LCP element, long tasks, blocking JavaScript, the cost of recalculating styles, a large DOM, layout shifts and slow interactions. It is especially useful for diagnosing INP, because it lets you perform a specific action (e.g. use a filter or select a variant).
How to prepare a Core Web Vitals report step by step?
Step 1. Define the purpose of the report. First establish whether the report concerns a single store, a comparison of competitors or a larger industry sample — these are three different projects. A single-store audit uses Search Console, GA4, your own RUM, server logs, order data, a test environment and information about plugins — the goal is to find and fix the problem. A competitor comparison has access mainly to public CrUX data, lab tests and public sub-pages (you do not see the server configuration, sales data or the private part of the checkout). An industry report requires describing the selection of domains, the inclusion/exclusion criteria, the method of confirming WooCommerce, the sample size, the measurement date, the missing data, the aggregation method and the anonymisation rules — without that the report is a set of results rather than a repeatable study.
Step 2. Build a representative sample of pages. A store cannot be assessed on the basis of the home page alone.
| Page type | Example |
|---|---|
| Home page | The store's main landing page |
| Category | A popular product listing |
| Category with filters | Listing after applying an important filter |
| Simple product | A product without variants |
| Variable product | Sizes, colours or configuration |
| Promotional product | Regular and reduced price |
| Search | Search results within the store |
| Cart | A product added to the cart |
| Checkout | Form, delivery and payment |
| Customer account | Login and order history |
The cart, checkout and account are usually non-indexed, personalised and visited by fewer people — for these you often need your own RUM or manual tests. When choosing products, include a popular product, one with many images, a variable one, one with reviews, one with a video or configuration, and the one receiving the most traffic from ads.
Step 3. Record the test conditions. The report should allow the measurement to be repeated — record the date and time, the examined URL, the page type, the device, the data source, the field data period, the tool version, the test location, the network conditions, the cache state, the number of runs, the login status, whether or not cookie consent was given, and the active A/B test variant. When comparing periods, keep the same conditions.
Step 4. Collect field data. Field data should be the main source of information about how the store works for real users. The order: open the CWV report in Search Console → check mobile and desktop separately → record the number of good/needs-improvement/poor groups → open the individual problems → note representative URLs → check them in PSI → establish whether PSI shows URL or origin data → check the history in CrUX Vis → if you have your own RUM, split the results by template and device. If a public source has no sample, write: "Insufficient field data for this URL. A lab test was carried out that should not be treated as a real-user result." A lack of CrUX data does not mean the page is fast or slow.
Step 5. Run the lab tests. Run lab tests several times under the same conditions and report the median: at least 3 runs for an important URL (5 for a larger study), separate mobile/desktop tests, a clean browser profile, disabled extensions, the same location and network, no deployments or heavy backups during the test. The median is the middle result after ordering the measurements — less susceptible to a single extreme run. Example: 2.3 s / 2.5 s / 2.6 s / 2.9 s / 5.8 s → median LCP = 2.6 s. Do not choose 2.3 s just because it is the best; a single 5.8 s should not automatically replace the analysis of the whole sample either.
Step 6. Test the interactions important for sales. INP requires real user actions, not just an automatic page load. Prepare a fixed scenario. Category: open filters → choose a brand → set a price range → change the sorting → clear the filters → go to the next page. Variable product: change the colour → choose the size → change the quantity → open the gallery → add to cart → open the mini-cart. Cart and checkout: change the number of products → apply a discount code → calculate delivery → choose a pickup point → change the payment method → trigger and fix a form error. AJAX lets you reload a fragment of the page without reloading the whole document — WooCommerce uses it, among other things, to update the cart, checkout fragments and part of the filters; a large number of consecutive AJAX requests can cause delays, especially when each one triggers heavy database queries or an external API. Record which interaction was slow, whether it occurred during loading, which script handled it, how long the main thread was blocked, how many layout elements were recalculated and whether the problem concerned a single plugin.
Step 7. Find the cause, not just the symptom. Every poor result should be linked to a technical hypothesis and evidence.
| Problem | Evidence | Probable cause |
|---|---|---|
| LCP 4.2 s on a product | The LCP element is a 1.8 MB image | Too large a file and late download |
| LCP 4.5 s with TTFB 2.1 s | The HTML document starts late | Server, database or a heavy plugin |
| INP 620 ms after using a filter | A long JavaScript task | Filters or an elaborate DOM |
| CLS 0.24 | Shift after a banner appears | No reserved space |
| Slow checkout | A series of consecutive AJAX requests | Delivery, taxes or payment |
Do not write only "JavaScript should be reduced". A better note: "After selecting a variant, plugin X's script blocks the main thread for about 480 ms. The problem occurs on variable products and concerns the main purchase interaction. Priority: high."
Step 8. Prioritise the fixes. The priority should result from the impact on the user and on sales, not from the order of recommendations in Lighthouse.
| Priority | Meaning | Example |
|---|---|---|
| P0 — critical | Blocks or seriously hinders a purchase | A broken button or checkout |
| P1 — high | Affects high traffic or the main template | Poor LCP of all products |
| P2 — medium | Worsens the experience but does not block a purchase | A shift in the reviews section |
| P3 — low | A housekeeping change with little impact | A small amount of unnecessary CSS |
Additionally assess the number of URLs affected, the share of traffic, the impact on mobile, the funnel stage, the difficulty of implementation, the risk of breaking the store and the ability to test the change. Reducing the logo by 15 KB may be easy but need not change the perceived speed; fixing a script that blocks variant selection requires more work but directly affects the purchase — it should have a higher priority.
Step 9. Test the fixes before deployment. Check performance changes on staging and across the full purchase process. After changing cache, JavaScript or the theme, test login, prices, variants, discount codes, the cart, deliveries, payments, emails, stock levels and analytics.
Cache: not one rule for the whole of WooCommerce
From full cache you must exclude, or handle appropriately: the cart, checkout, customer account, login-dependent content, individual prices, location-dependent data and elements with session data. A misconfigured cache can improve the test result while showing the customer someone else's cart or the wrong price.
Step 10. Verify the results after deployment. The lab result can be checked immediately, but field data changes gradually over the 28-day CrUX window. After deployment: repeat the lab tests under the same conditions → check the purchase process → compare the medians before and after → observe your own RUM → check the trend in CrUX Vis → run problem validation in Search Console → monitor the result over the following weeks. Do not expect the whole Search Console report to turn green the next day — new visits gradually replace older data, and a lasting improvement will become visible in the field results over time.
What should the structure of the report look like?
The report should lead from the business summary to the technical evidence and the implementation plan.
1. Summary for the owner (one page): the overall state, the most important problem, the affected templates, the potential impact, the first three actions, the way to verify. 2. Scope and methodology: examined URLs, devices, data period, sources, number of runs, limitations, missing data. 3. Field data: LCP/INP/CLS p75, share of good visits, trend, mobile/desktop, URL vs origin. 4. Lab results: median LCP, TBT, CLS, TTFB, page size, number of requests, LCP element, long tasks. 5. Analysis by template: separately the home page, categories, products, cart, checkout. 6. List of problems: for each one a description, evidence, affected URLs, impact, priority, recommendation, person responsible, way to test. 7. Implementation plan: quick fixes, development work, server changes, theme changes, plugin changes, monitoring.
An example results table
The data below shows how to build the table — it is not the result of a specific store.
| Page type | Source | LCP | INP/TBT | CLS | TTFB | Status | Main problem |
|---|---|---|---|---|---|---|---|
| Home page | CrUX URL | 2.3 s | 180 ms | 0.05 | 0.7 s | Good | None |
| Category | RUM | 3.2 s | 240 ms | 0.08 | 0.9 s | Needs improvement | Banner and filters |
| Product | CrUX group | 4.1 s | 310 ms | 0.12 | 1.4 s | Poor | Image and server |
| Cart | Lab | 2.8 s | TBT 390 ms | 0.04 | 1.1 s | Diagnostics | Cart scripts |
| Checkout | Manual test | — | Slow validation | 0.03 | 1.6 s | Critical | Payment and delivery |
The "—" sign does not mean a result of 0 — it means the metric was not reliably measured in the given source.
How to report the result of the whole store?
Do not reduce the whole of WooCommerce to a single average figure.
Better aggregate indicators are the percentage of groups with a good result, the percentage of visits passing all three metrics, the results of the most important templates, mobile vs desktop, the trend relative to the previous period, the number of P0 and P1 problems and the share of traffic affected by the problem. Do not mix in one average LCP in seconds, INP in milliseconds, CLS without a unit and the Lighthouse score 0–100.
Methodology of a public WooCommerce industry report
A public report requires a clearly described sample, qualification criteria and aggregation rules.
Selection of stores. Define the number of domains, the country and language, the method of detecting WooCommerce, the requirement for an active store, the minimum offer elements, the data-collection period and the way of handling subdomains and language versions.
WooCommerce verification. Automatic technology detection can be wrong — confirm the sample on the basis of the source code, characteristic WooCommerce resources, endpoints, the cart structure and a manual check of part of the domains. An endpoint is a specific address or point of communication through which an application provides data or accepts requests. If the report covers headless stores, mark them separately — headless means that WooCommerce works as a backend while the layer visible to the customer was built in a different technology.
Missing data. Do not remove all stores without CrUX without explanation. Show how many domains had full data, how many only origin data, how many had no data and how many were excluded and for what reason. A lack of CrUX data is not a performance result.
Anonymisation. If the goal is to describe the condition of the market, publish primarily aggregate results. A list of the "slowest stores" can lead to misleading conclusions, because you do not know the changes deployed during the study, the experiments, the user locations, the traffic structure, the server conditions or the technical causes. Publish the names of specific stores only when the methodology and context justify it.
The most common WooCommerce problems by metric
LCP problems are most often caused by: a slow server, a heavy main image, a slider, lazy loading of the LCP element, late detection of a resource, blocking CSS, a heavy font and a banner triggered by JavaScript. Check first: which element is the LCP, what the TTFB is, when the browser detects the resource, how large the file is, whether it has correct dimensions, whether it is loaded with priority and what delays its rendering. Preload is an instruction that a given resource should be downloaded by the browser earlier and with high priority — do not set it for all images; priority should be given to the actual element needed at the start of loading.
INP problems are most often caused by: heavy filters, a large number of variants, an elaborate DOM, a page builder, advertising scripts, chat, a recommendation system, the mini-cart, review scripts and long JavaScript tasks. Check first the slowest interactions, the long tasks, the script responsible for the event, the number of elements recalculated, the behaviour during loading and the result after disabling the suspect plugin on staging.
CLS problems are most often caused by: a lack of image dimensions, a change in gallery height, dynamic variant prices, a promotion bar, a cookie banner, a font that changes the width of the text, a reviews widget, WooCommerce notices and a sticky menu. Check first the element causing the largest shift, whether its space is reserved, whether the change occurs after cookie consent, whether the problem appears after selecting a variant and whether it occurs during scrolling.
TTFB problems are most often caused by: hosting unsuited to the store, slow PHP, a heavy database, queries without indexes, excessive autoload, no object cache, external APIs, a large number of plugins, the load from bots and cron tasks executed during a visit. Cron is a mechanism that runs scheduled tasks (product synchronisation, message sending, data cleaning). Redis or another object cache can reduce the number of repeated queries, but it will not fix a poorly written plugin or a slow response from an external API. More actions in the guide how to speed up a WooCommerce store and in the article hosting for WooCommerce — how to choose.
The most common mistakes in Core Web Vitals reports
The most frequently repeated mistakes distort the picture of performance and lead to bad decisions.
Reporting a single test — one run can turn out extreme; report the median of several measurements. Testing only the home page — it may be fast when the product, filters and checkout have serious problems. Mixing field and lab data — do not average LCP from CrUX with LCP from Lighthouse. Treating a score of 90 as passing CWV — Lighthouse does not replace real data for LCP, INP, CLS. Reporting TBT as INP — TBT supports the diagnosis, but it is a different measurement. No URL vs origin information — whole-domain data is not the result of a specific product card. No testing of the purchase process — the report may improve the home page while leaving filters, the cart and payment slow. Installing yet another "speed" plugin — several cache tools can modify the same resources and cause hard-to-reproduce errors. No test after deployment — a better result has no value if variants, the cart or payments have stopped working.
What can you check yourself?
You can carry out a basic diagnosis by going through the list below for several page types.
- Open the Core Web Vitals report in Google Search Console.
- Check mobile and desktop separately.
- Test the home page, a category and a product.
- Establish whether the PSI data refers to a URL or an origin.
- Record the LCP element of each examined page.
- Compare the TTFB of the individual templates.
- Carry out at least three runs.
- Open the store on a phone in private mode.
- Use filters and variants.
- Add a product to the cart.
- Go through delivery and payment.
- Pay attention to shifts of the purchase button.
- Compare the behaviour before and after cookie consent.
- Record the date, the device and the measurement conditions.
You can also use the lost-sales calculator to estimate how much a slow store costs.
When is it worth commissioning a specialist?
Technical help is needed when the result indicates a problem but it is unclear which layer of WooCommerce causes it or how to change it safely.
It is worth commissioning an analysis when Search Console shows poor groups of URLs, the lab and field results differ significantly, the store has no public CrUX data, you do not know which element is the LCP, INP deteriorates after using filters, the checkout works slowly despite a fast home page, a cache change causes cart errors, the store has many plugins, problems appeared after a rebuild, TTFB rises during higher traffic, you need a report for the board or a client, you want to compare results before and after a migration, you need your own RUM, or the implementation requires changes to the theme, a plugin or the server. In such a case you need not only a speed test but a technical SEO audit combining field data, lab tests, an analysis of the code, the server and the most important WooCommerce templates. If the main problem is the infrastructure, also check the server for WordPress and WooCommerce.
Frequently asked questions
Which Core Web Vitals apply in 2026?
LCP, INP and CLS. The good thresholds are LCP up to 2.5 seconds, INP up to 200 milliseconds and CLS up to 0.1, assessed at the 75th percentile of visits.
Do Core Web Vitals affect positions in Google?
Core Web Vitals are part of a broader page-experience assessment, but they are not a standalone factor guaranteeing a high position. The relevance and quality of content still have fundamental importance.
Why does PageSpeed show a good result while Search Console shows a poor one?
PageSpeed may show the current lab test, whereas Search Console is based on real-user data from the last 28 days. These are different sources and periods.
Does a Lighthouse score of 90 mean the store passes Core Web Vitals?
No. The Lighthouse score is a lab assessment. Passing Core Web Vitals requires good field data for LCP, INP and CLS.
What does "no data" in PageSpeed Insights mean?
Most often the given URL or the whole domain does not have a sufficient number of qualifying visits in CrUX. A lack of data means neither a good nor a poor result.
How many times should the PageSpeed test be run?
For a basic diagnosis it is worth carrying out at least three runs under the same conditions and recording the median. For a comparative report you can use five or more runs.
Should you analyse mobile or desktop?
Both device types should be analysed separately. Mobile usually poses more difficult technical conditions, but the priority is worth setting also on the basis of the actual share of traffic.
How often should a Core Web Vitals report be prepared?
Constant monitoring can run daily. A full report is worth preparing before a larger deployment, after its completion and periodically, for example once a quarter.
The goal is not 100 points, but an efficient store
A reliable Core Web Vitals report for WooCommerce does not come down to the PageSpeed score. It should separate field and lab, show the 75th percentile, examine mobile and desktop, cover different sub-page types, test purchase interactions, include TTFB diagnostically, indicate a specific cause, prioritise the fixes, describe the methodology and compare the result before and after deployment.
The goal is not to achieve 100 points, but a store that quickly shows the product, responds to the customer's actions, does not shift buttons and lets you proceed to payment without trouble. If you want to check the Core Web Vitals of your WooCommerce, we can prepare a report covering CrUX, Search Console, Lighthouse, the key templates, filters, products and checkout:
- Technical SEO — results, causes, implementation priorities and the way to check the effects.
- WordPress and WooCommerce servers — when the source of the problem is the infrastructure and TTFB.
- Core Web Vitals — the basics and how to speed up a WooCommerce store — related guides.